 In the digital age, information is power, and presenting it in a visually appealing and interactive way can make all the difference.
Enter ChatGPT, a revolutionary language model developed by OpenAI that goes beyond text generation.
In this blog post, we’ll explore the exciting realm of creating dynamic and interactive infographics using ChatGPT, unlocking a new dimension of creativity and engagement.
Understanding ChatGPT’s Capabilities.
ChatGPT is a language model that uses deep learning to generate human-like text based on the input it receives.
While its primary function is generating text, the versatility of ChatGPT extends to various creative applications, including infographic creation.
By leveraging its natural language processing capabilities, you can instruct ChatGPT to design visually compelling and interactive infographics tailored to your content.
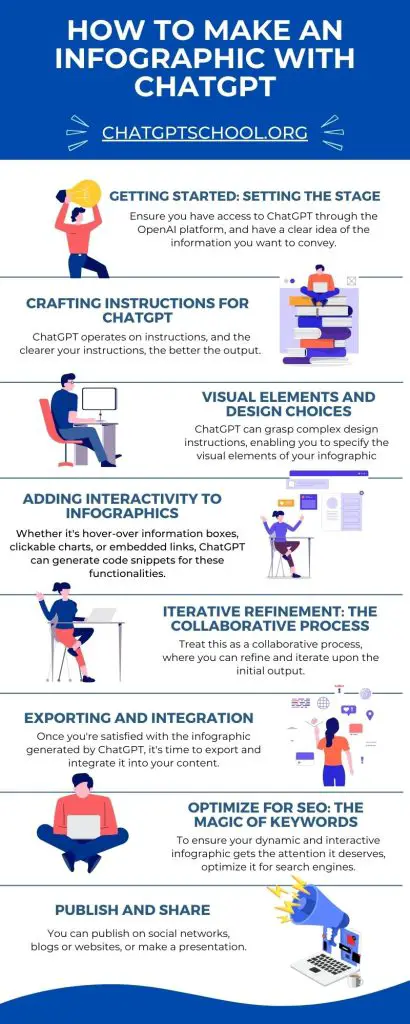
Getting Started: Setting the Stage.
Before diving into the intricacies of creating infographics, it’s essential to set the stage.
Make sure that you have access to ChatGPT through the OpenAI platform, and have a clear idea of the information you want to convey.
Whether it’s statistical data, step-by-step guides, or comparisons, having a well-defined concept will streamline the infographic creation process.
Crafting Instructions for ChatGPT.
Crafting clear and effective instructions for ChatGPT is a crucial step in generating the desired output, especially when it comes to creating dynamic and interactive infographics.
Here are some detailed tips on crafting instructions for ChatGPT:
1. Be Specific and Detailed:
- Provide clear and specific details about the content you want in the infographic. Specify the data points, key messages, or any specific information that should be included.
- Example: “Create an infographic illustrating the market share of renewable energy sources in the last five years. Include data on solar, wind, and hydroelectric power with percentage breakdowns.”
2. Describe Visual Elements Clearly:
- Clearly articulate the visual elements you want in the infographic. This includes charts, graphs, icons, or any other design elements that are integral to conveying your message.
- Example: “Incorporate a pie chart to represent the distribution of energy sources. Use green for solar, blue for wind, and turquoise for hydroelectric power.”
Visual Elements and Design Choices.
ChatGPT can grasp complex design instructions, enabling you to specify the visual elements of your infographic.
Describe the type of charts, graphs, and icons you want to include. If you’re unsure, you can ask ChatGPT for design recommendations based on the nature of your content. Remember to specify:
- Color palette: Choose colours that resonate with your brand or the message you want to convey.
- Font styles: Opt for fonts that are easy to read and complement the overall design.
- Imagery: Specify the types of images or icons you want to include to enhance visual appeal.
Adding Interactivity to Infographics.
One of the most exciting features of ChatGPT is its ability to incorporate interactive elements into infographics.
Whether it’s hover-over information boxes, clickable charts, or embedded links, ChatGPT can generate code snippets for these functionalities.
Simply instruct ChatGPT to make the infographic interactive and provide details on the elements you want users to engage with.
For example:
“Include clickable regions on the infographic that provide additional information when users hover over them. Use this feature to explain key points or link to external sources.”
Iterative Refinement: The Collaborative Process.
Creating the perfect infographic may require some back-and-forth with ChatGPT. Treat it as a collaborative process, where you can refine and iterate upon the initial output. Ask for modifications, suggest alternative layouts, and experiment with different design elements until you achieve the desired result.
Exporting and Integration.
Once you’re satisfied with the infographic generated by ChatGPT, it’s time to export and integrate it into your content (like I did above) 😉
Optimizing for SEO: The Magic of Keywords.
To ensure your dynamic and interactive infographic gets the attention it deserves, optimize it for search engines. Incorporate the keyword phrase “Creating Dynamic and Interactive Infographics with ChatGPT” strategically in your content, image alt text, and meta description.
This will improve the discoverability of your infographic on search engine result pages.
Conclusion: A New Era of Infographic Creation.
ChatGPT opens up a new era of infographic creation, offering a unique blend of creativity and automation.
By tapping into its natural language processing capabilities, you can instruct ChatGPT to design infographics that are not only visually stunning but also interactive, captivating your audience in ways traditional static visuals cannot.
Experiment with ChatGPT, refine your instructions, and watch as your ideas come to life in the form of dynamic and interactive infographics that elevate your content to new heights.
The marriage of artificial intelligence and creative expression has never been more promising. Embrace the future of infographic creation with ChatGPT.